Saturday, 15 March 2014

Weblogic Server, Multi DataSource, Load Balancing and Failover


Multi DataSource, Load Balancing and Failover

If you have some idea on Data Source, clustering and cluster algorithms then it's very easy for you to understand Multi Data Source. 

Let me give you some idea. Data Source is a group of ready to use data base connection which is used to get connections) from database as well as for better performance. Since, all the connection created at server startup ( based on the max connection limit defined ) thus it don't make any overhead on application and application server to get connections dynamically at run time. application pick the connection from data source connection pool, used it and returned back to the pool. certain cases you must heard about connection leaking, it nothing just the connection(s) opened in pool, taken by the application but never returned to the pool. most of times it happened when developers didn't close the pool with proper syntax.

Just like a cluster where we grouped different managed server for high availability, Multi Data Source is also just a group of Data Sources used for high availability to provide load balancing and failover capabilities for JDBC connections. 

and like cluster algorithms, there are two algorithms provided with Multi Data Source, First one is round robin, and second one is Failover. as you can understand from the name itself, round robin is just to load balance the load equally between all data sources and Failover is to provide failover capabilities, but during lot's of technical interviews i had taken, i felt the use of Failover is not very clear to majority of guys :), let read below.


Round Robin Algorithm :

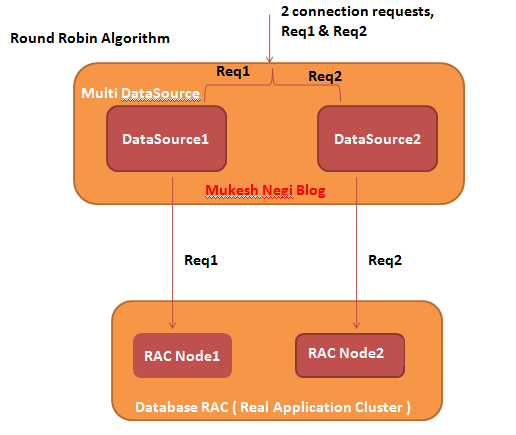
This algo simple load balance the requests between all assigned data sources. As shown in figure below, if your multi data source get 2 requests, then it will equally divert them between both available data source in cyclic manner. 


Failover Algorithm :

Data Source or Multi Data Source don't do the failover of current active connections, like if some connection which is server by data source1 got disconnect between processing some requests, then data source or multi data source will not failover request to other available connection, it can be handled at database level.

With this algorithm, doesn't matter how many data sources you have assigned to the multi data source, every request will be serve by the primary first data source in the list until and unless it got failed due to any reason. In that case, if your primary  data source got down, all incoming requests will be server by the second data source till first primary data source recovered. 


Based on the data source connect string configuration at database listener level, round robin algorithm could be like below


Based on the data source connect string configuration at database listener level, Failover algorithm could be like below

Based on the data source connect string with database service name configuration at database listener level, round robin algorithm could be like below


Based on the data source connect string with database service name configuration at database listener level, failover algorithm could be like below


Sunday, 9 March 2014

Apache : Concurrent threads, Idle threads, max and min possible threads ( Max and Min connections )


Apache : Concurrent threads, Idle threads, max and min possible threads ( Max and Min connections )

Based on the MPM ( multi processing modules ) your apache web server is using, below are the important parameters those governs all these configurations


# StartServers                 : initial number of server processes to start
# MaxClients                   : maximum number of simultaneous client connections
# MinSpareThreads         : minimum number of worker threads which are kept spare
# MaxSpareThreads        : maximum number of worker threads which are kept spare
# ThreadsPerChild           : constant number of worker threads in each server process

# MaxRequestsPerChild   : maximum number of requests a server process serves

For example - 

ServerLimit 16
StartServers 2
MaxClients 200
MinSpareThreads 25
MaxSpareThreads 75
ThreadsPerChild 25


1. First of all, whenever an apache is started, it will start 2 child processes which is determined      by StartServers parameter. 

2. Then each process will start 25 threads determined by ThreadsPerChildparameter so this      means 2 process can service only 50 concurrent connections/clients i.e. 25x2=50. 

3. Now if more concurrent users comes, then another child process will start, that can service          another 25 users. 

4. But how many child processes can be started is controlled by ServerLimit parameter, this    means that in the configuration above, I can have 16 child processes in total, with each child       process can handle 25 thread, in total handling 16x25=400 concurrent users. 

5. But if number defined in MaxClients is less which is 200 here, then this means that after 8      child processes, no extra process will start since we have defined an upper cap                  
   of MaxClients. 

6. This also means that if I set MaxClients to 1000, after 16 child processes and 400     
    connections, no extra process will start and we cannot service more than 400 concurrent    
    clients even if we have increase the MaxClient parameter. 

In this case, we need to also increase ServerLimit to 1000/25 i.e. MaxClients/ThreadsPerChild=40 So this is the optmized configuration to server 1000 clients

So, the good configuration will be 


<IfModule mpm_worker_module>
    ServerLimit          40
    StartServers          2
    MaxClients          1000
    MinSpareThreads      25
    MaxSpareThreads      75 
    ThreadsPerChild      25
    MaxRequestsPerChild   0
</IfModule>

Saturday, 23 March 2013

Weblogic Server Security

Weblogic JMS ( Java Messaging Service )


Weblogic JMS ( Java Messaging Service )


Understanding JMS Basics
Weblogic JMS Clustering


Weblogic Server Performance Tuning

Weblogic Server Performance Tuning

Guys, I am still updating this page, give me few more days for this :)

Performance tuning is depend on lot's of factors like - 


Operating System 

If your operating system is properly tuned or not, there are lot's of O.S parameters need to be tune by your System Administartor and for some parameters some specific values recommended by the oracle according to different operating systems.

Application

Weblogic performance is depend on your application code also and lots of time the performance issues are there due to poor code, like in some cases database connection not closed properly cause threads got stuck or jvm out of error issues.

Database

Database is also one of the major factor if your application using the database and lots of parameters need to be taken care at database side also when you start thinking about your weblogic server tuning like processes, open_cursors, SGA, number of supported users etc


Specific to Weblogic


Specific to weblogic, the first point came to everybody mind is the JVM & heap , and yes JVM & heap both are the main factors of weblogic performance tuning since your servers run on JVM and all of the objects are processed under your JVM heap, So you need to more careful
on defining the heap size since excess and shortage of anything could be harmful, So excess of heap as well as shortage of heap both could impact your application server performance.


VM Heap Size and Garbage Collection

The Java heap is where the objects of a Java program live. It is a repository for live objects, dead objects, and free memory. 

When an object can no longer be reached from any pointer in the running program, it is considered "garbage" and ready for collection and this cleaning process called garbage collection.

The JVM heap size determines how often and how long the VM spends collecting garbage. An acceptable rate for garbage collection is application-specific and should be adjusted after analyzing the actual time and frequency of garbage collections. If you set a large heap size, full garbage collection is slower, but it occurs less frequently. If you set your heap size in accordance with your memory needs, full garbage collection is faster, but occurs more frequently.

The goal of tuning your heap size is to minimize the time that your JVM spends doing garbage collection while maximizing the number of clients that WebLogic Server can handle at a given time. To ensure maximum performance during benchmarking, you might set high heap size values to ensure that garbage collection does not occur during the entire run of the benchmark.


The factors need to keep in mind before heap setting is - 

1. If you are using 32bit or 64 bit O.S  

Since there is a limitation of max heap for a JVM  according to bit of O.S. For a 32-bit process model, the maximum virtual address size of the process is typically 4 GB, though some operating systems limit this to 2 GB or 3 GB. For 64-bit process models, the maximum is essentially unlimited.

2. What is the total RAM of your O.S

Since you have to define heap for your servers according to the availability of RAM as well as you can define up to 80% of available for your weblogic servers and need to keep rest 20% for your O.S process.

3. Minimum and Maximum heap

You should define minimum heap size of your JVM equal to the maximum heap size for better performance to minimize the garbage collection since your JVM paused during the garbage collection period.

4. JVM vendor and version

Use only production JVMs on which WebLogic Server has been certified. 

5.