
Weblogic Diagnostic Framework ( WLDF )
Do you know what is Weblogic Diagnostic Framework ( WLDF ) ?
No, Check my another page on "What is Weblogic Diagnostic Framework ( WLDF )"
The WebLogic Diagnostic Framework (WLDF) consists of a number of components that work together to collect, archive, and access diagnostic information about a WebLogic Server instance and its applications.
Here I am assuming you have basic idea on Weblogic Diagnostic Framework ( WLDF ).
Create Diagnostic Image In Case Free Heap Percentage Less Than or Greater Than a Specific Value
Create Diagnostic Image In Case Free Heap Percentage Less Than or Greater Than a Specific Value
Login to admin console, go to option "Diagnostic Modules" and click on New option
 [ Weblogic Diagnostic Framework ( WLDF ) ]
Provide a name and click on Ok button, you will see your newly created module there
 [ Weblogic Diagnostic Framework ( WLDF ) ]
Now click on Targets tab and select the server for which you want to create the diagnostic image in case heap less or more than some specific value, after saving target, click on collected metrics tab, update sampling period to 15000, means 15 seconds.
Note : - it mean collected metrics will collect the heap details in every 15 seconds, it doesn't mean it will fire or create diagnostic image in 15 secs, for this you will later create notification, here it will only gather the current heap in every 15 seconds.
 [ Weblogic Diagnostic Framework ( WLDF ) ]
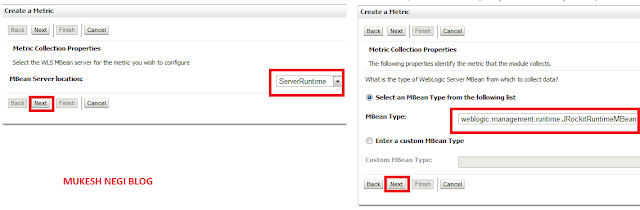
Click on next, select mbean option as "ServerRuntime", click next and on next screen, select mbean type as shown on below figure "JrockitRuntimeMbean" because we are going to collect runtime jvm size
[ Weblogic Diagnostic Framework ( WLDF ) ]
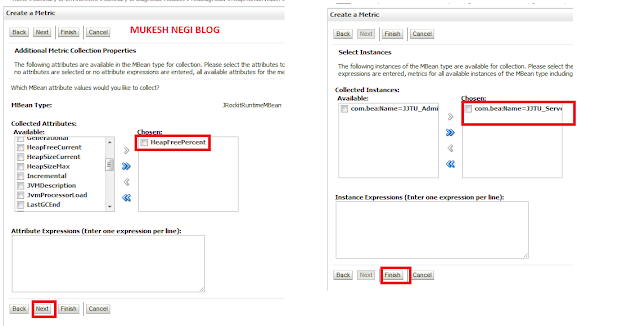
Now select attribute "HeapFreePercent" and on next screen select your target server and click on finish.
[ Weblogic Diagnostic Framework ( WLDF ) ]
now you will see your created collected metrices as below

[ Weblogic Diagnostic Framework ( WLDF ) ]
Now click on "watch and notification" tab, then click on notification and New, select type as diagnostic image and click on next, enter notification name and click next

[ Weblogic Diagnostic Framework ( WLDF ) ]
select the default path and click on finish. you will see your notification under Notifications tab.

[ Weblogic Diagnostic Framework ( WLDF ) ]
Now click on watches tab and new, enter watch name and type as collected metrices and make sure enable watch option is checked there, click on next

[ Weblogic Diagnostic Framework ( WLDF ) ]
click on add expression button and next, select mbean server location as below screenshot ServerRuntime.

[ Weblogic Diagnostic Framework ( WLDF ) ]
Select the mbean type as below, click next and select your target
 [ Weblogic Diagnostic Framework ( WLDF ) ]

[ Weblogic Diagnostic Framework ( WLDF ) ]
click on next, select the automatic reset alarm value as 20 and click on finish ( this is the actual value which trigger the alarm or here you can say it's the actual time which will create the diagnostic image in every 20 seconds. for further details check "Diagnostic Framework : Basic concepts"

[ Weblogic Diagnostic Framework ( WLDF ) ]
now you can able to see your watch under Wathches section as below

[ Weblogic Diagnostic Framework ( WLDF ) ]
now got to your server_logs/diagnostic_image directory and you will see the diagnostic images will create in every 20 secs like below when your condition will meet ( here if heapfreepercent > 20% )

[ Weblogic Diagnostic Framework ( WLDF ) ]
WLDF Console extension : http://weblogicserveradministration.blogspot.in/2012/10/weblogic-monitoring-dashboard.html
Thank You!!!!
Do you know what is Weblogic Diagnostic Framework ( WLDF ) ?
No, Check my another page on "What is Weblogic Diagnostic Framework ( WLDF )"
The WebLogic Diagnostic Framework (WLDF) consists of a number of components that work together to collect, archive, and access diagnostic information about a WebLogic Server instance and its applications.
Here I am assuming you have basic idea on Weblogic Diagnostic Framework ( WLDF ).
Create Diagnostic Image In Case Free Heap Percentage Less Than or Greater Than a Specific Value
Keywords : weblogic diagnostic framework, weblogic diagnostic modules, Configuring Diagnostic Modules,Create WebLogic Diagnostic Image, WebLogic Diagnostic Framework (WLDF), Configuring and Using the WebLogic Diagnostic Framework, The Weblogic Diagnostic Framework
Create Diagnostic Image In Case Free Heap Percentage Less Than or Greater Than a Specific Value
Login to admin console, go to option "Diagnostic Modules" and click on New option

Provide a name and click on Ok button, you will see your newly created module there

Now click on Targets tab and select the server for which you want to create the diagnostic image in case heap less or more than some specific value, after saving target, click on collected metrics tab, update sampling period to 15000, means 15 seconds.
Note : - it mean collected metrics will collect the heap details in every 15 seconds, it doesn't mean it will fire or create diagnostic image in 15 secs, for this you will later create notification, here it will only gather the current heap in every 15 seconds.

Click on next, select mbean option as "ServerRuntime", click next and on next screen, select mbean type as shown on below figure "JrockitRuntimeMbean" because we are going to collect runtime jvm size

[ Weblogic Diagnostic Framework ( WLDF ) ]
Now select attribute "HeapFreePercent" and on next screen select your target server and click on finish.

[ Weblogic Diagnostic Framework ( WLDF ) ]
now you will see your created collected metrices as below

[ Weblogic Diagnostic Framework ( WLDF ) ]
Now click on "watch and notification" tab, then click on notification and New, select type as diagnostic image and click on next, enter notification name and click next

[ Weblogic Diagnostic Framework ( WLDF ) ]
select the default path and click on finish. you will see your notification under Notifications tab.

[ Weblogic Diagnostic Framework ( WLDF ) ]
Now click on watches tab and new, enter watch name and type as collected metrices and make sure enable watch option is checked there, click on next

[ Weblogic Diagnostic Framework ( WLDF ) ]
click on add expression button and next, select mbean server location as below screenshot ServerRuntime.

[ Weblogic Diagnostic Framework ( WLDF ) ]
Select the mbean type as below, click next and select your target

Now select attribute as HeapFreePercent, operator and value ( here I am selecting to create an diagnostic image in case free heap percentage is above 20% )

[ Weblogic Diagnostic Framework ( WLDF ) ]
click on next, select the automatic reset alarm value as 20 and click on finish ( this is the actual value which trigger the alarm or here you can say it's the actual time which will create the diagnostic image in every 20 seconds. for further details check "Diagnostic Framework : Basic concepts"

[ Weblogic Diagnostic Framework ( WLDF ) ]
now you can able to see your watch under Wathches section as below

[ Weblogic Diagnostic Framework ( WLDF ) ]
now got to your server_logs/diagnostic_image directory and you will see the diagnostic images will create in every 20 secs like below when your condition will meet ( here if heapfreepercent > 20% )

[ Weblogic Diagnostic Framework ( WLDF ) ]
WLDF Console extension : http://weblogicserveradministration.blogspot.in/2012/10/weblogic-monitoring-dashboard.html
Thank You!!!!
No comments:
Post a Comment